
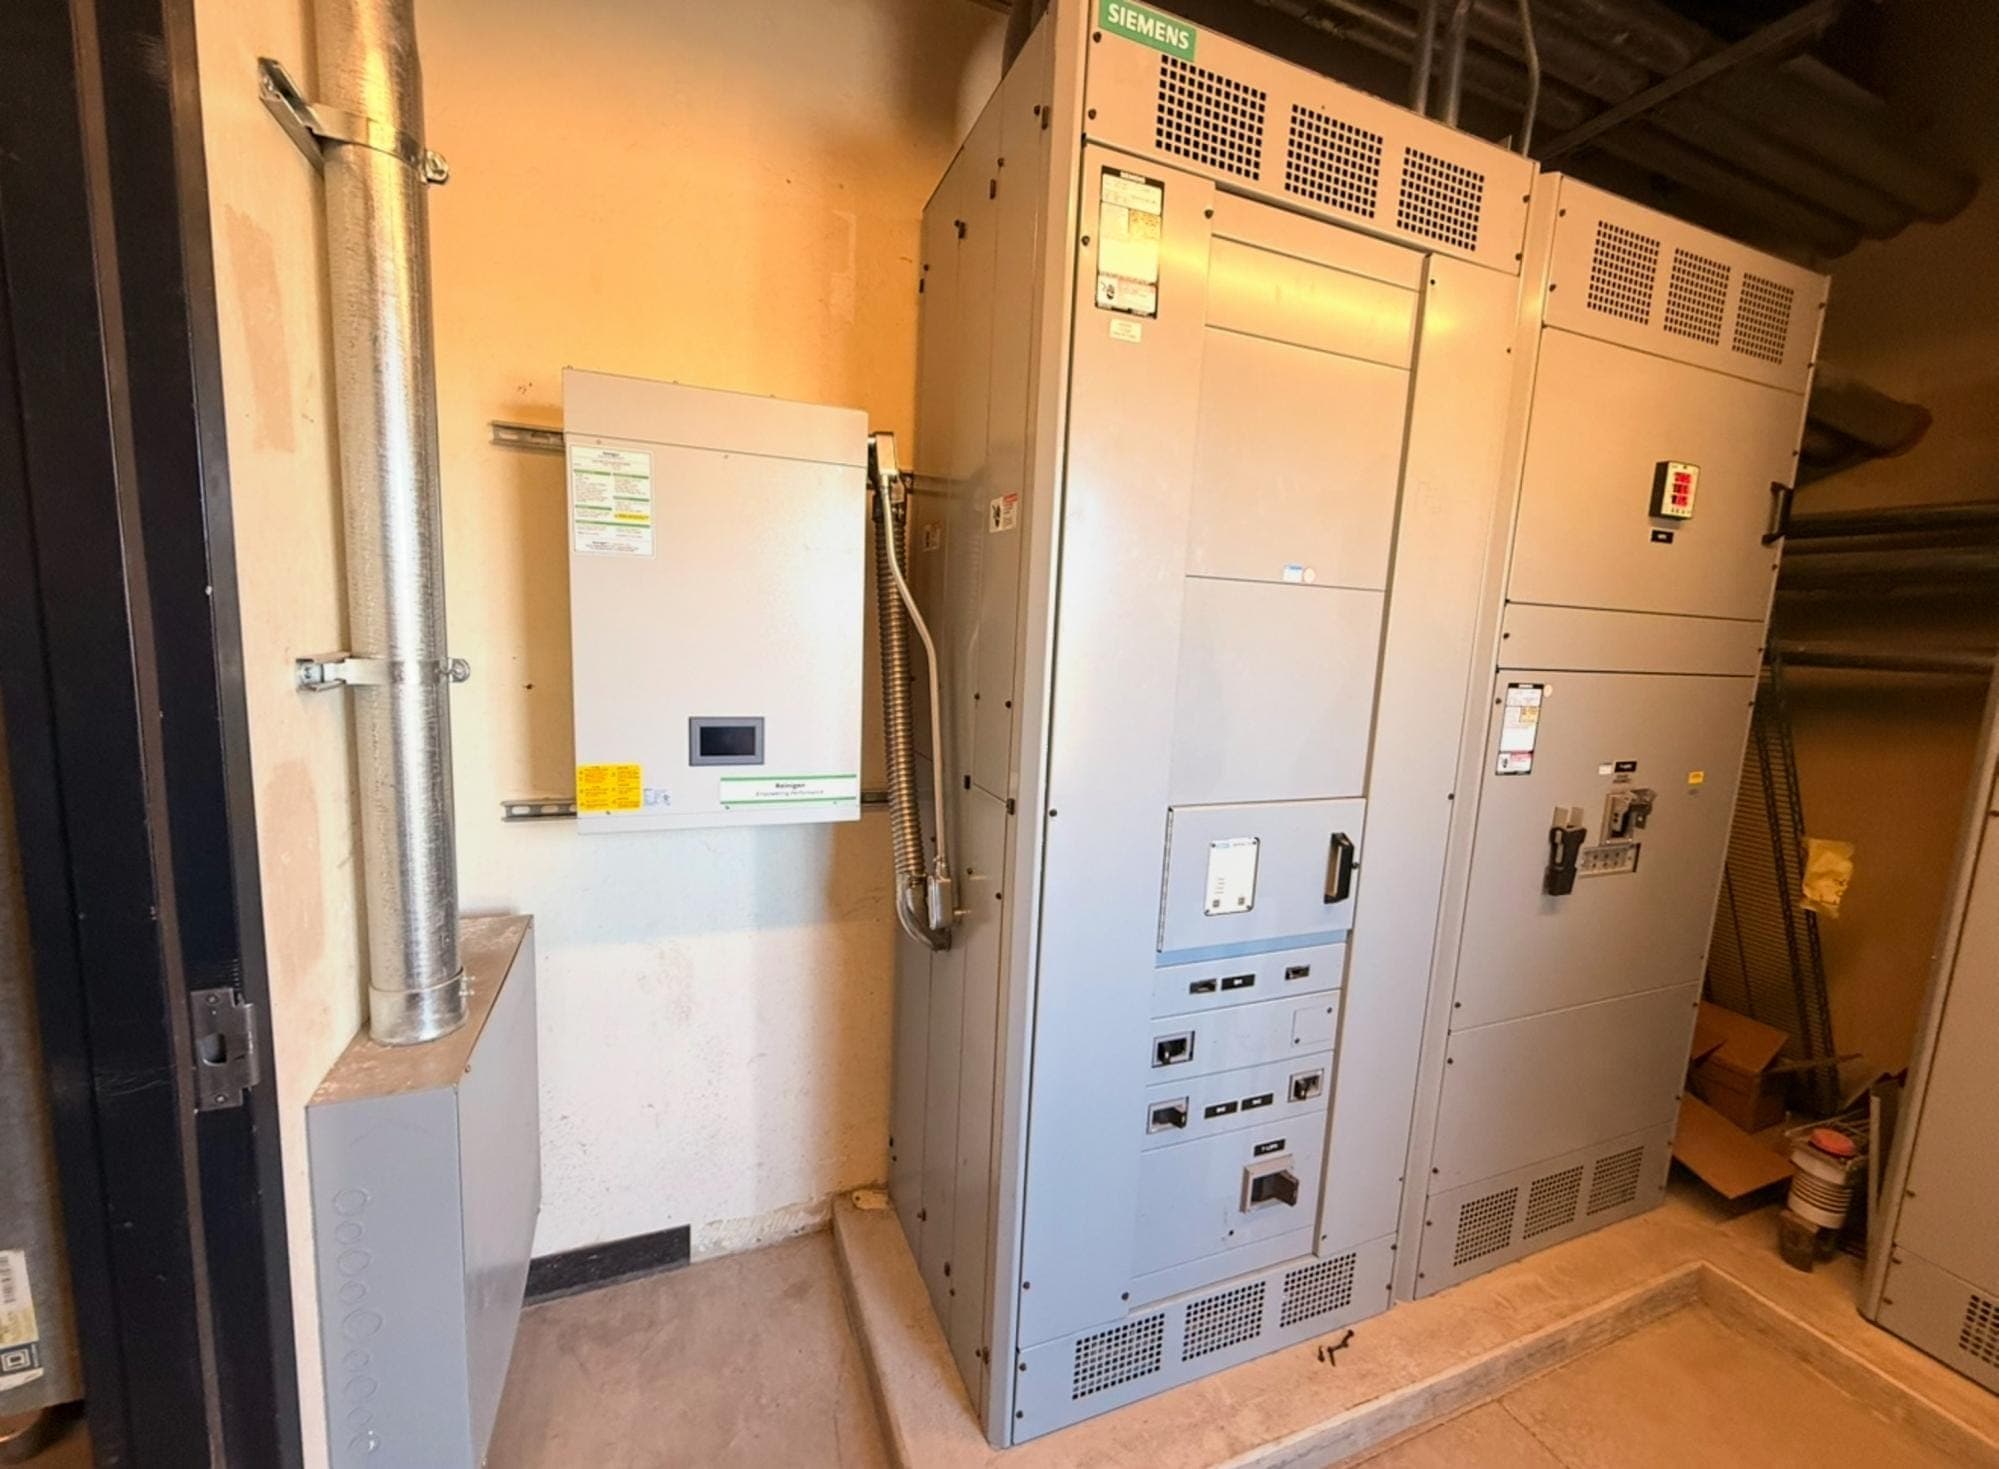
Your transformers are carrying power you never use.
Motors, chillers, compressors and drives draw reactive and harmonic current that does no work. It fills transformer capacity, heats cables and equipment, and raises demand and power-factor charges wherever your utility bills them. We measure it, correct it on a six-month rental, and let your own meter make the case.
Before-and-after figures: one distribution facility’s main switchboard. See the meter data
Current that does no work still costs money.
Every motor and transformer needs reactive power to build its magnetic field. That power flows back and forth without doing work, but it still travels through your transformers, switchgear and cables as current. Drives, LED drivers and other electronic loads add harmonic current on top, which adds heat and can upset sensitive equipment.
Demand and power-factor charges
Many utilities bill commercial demand in kVA, add a charge below a set power factor, or bill kVAR directly. Reactive power raises all three. Your tariff sheet says which apply to you.
Heat and lost capacity
Losses in cables and transformers rise with the square of current (I²R). Less current means cooler equipment, and capacity on your existing transformer that can carry new load.
Harmonics and failures
Drives and electronic power supplies inject 5th, 7th, 11th and higher harmonics. The symptoms: nuisance trips, hot neutrals, flicker, and motors that keep failing for no mechanical reason.
Same switchboard, same meter.
A distribution facility’s main switchboard, recorded for five days in June 2024 and again for seven days in April 2026 after a Reinigen unit went in. Power factor went from an average of 0.87, dipping to 0.79, to 1.00. Reactive power fell from an average of 101 kVAR to 3.
Play the weeks back
The same days of the week, two years apart, on the facility’s own meter: Wednesday noon to Monday morning, half an hour at a time.
0.836
power factor
120 kVA carried for every 100 kW of work
Below 0.90Below 0.90 for 24.5 of 27 hours so far
0.999
power factor
100 kVA carried for every 100 kW of work
0.90 or betterBelow 0.90 for 0 of 27 hours so far
- Before · 12–17 June 2024
- After · 22–27 April 2026
- 0.90, a common US utility threshold (others use 0.85 or 0.95)
Drag across the chart to scrub. Half-hour averages traced from the power recorder’s own charts; the two weeks line up by weekday and clock time. They ran different loads, June and April, so the replay compares power factor only, never kW or dollars. The April recording’s first reading (0.950, logged as the recorder started on the Tuesday) falls before the window shown.
Thursday 2:30 pm. Before 0.836, below 0.90. After 0.999.
What the dials are measuring
Power factor, as a beer. The beer is the work you use. The foam does no work, but the utility still has to fill the whole mug, and your wires still have to carry it.
115 kVA
delivered to get 100 kW of work done
- Beer: the work
- 100 kW
- Foam: does no work
- 15 kVA
- The mug to fill
- 115 kVA
At 0.87, 13% of everything the wires carry is foam. It fills the transformer and heats the cables, and some US utilities bill for it.
Drawn to scale for 100 kW of work: the foam is the extra kVA the wires carry (kVA − kW). The presets are the measured case’s average and lowest readings before correction, and its average after.
The two recordings come from different seasons, so the facility’s real load also changed. We show power factor and reactive power, which are the unit’s work, and leave the kW difference out of the savings.
Full results and methodRun your own numbers.
Your bill’s kWh and kVARh give your power factor. A few more numbers give what it costs, what correction frees up and which unit it takes.
All five tools- Power Factor CheckYour power factor from the numbers on your bill or your meter.
- Power-Factor CostWhat low power factor adds to your utility bill, and what correction would recover.
- Which Unit FitsThe reactive power to correct, and whether that is a Reinigen unit at a panel or an MPTS cabinet at the service.
Measure. Analyze. Demonstrate. Verify. Decide.
Nothing is recommended until your system has been measured, and nothing is bought until the equipment has proven itself on that same system.
Measure
A site survey and temporary metering: voltage, current, kW, kVA, kVAR, power factor and harmonics.
Analyze
An engineering report on root causes, equipment at risk and what the problem costs you.
Demonstrate
The recommended unit goes in on a six-month rental. Your own electrician installs it.
Verify
The same measurements run again, so before and after sit side by side.
Decide
Buy, lease, keep renting, expand to more panels, or send it back.
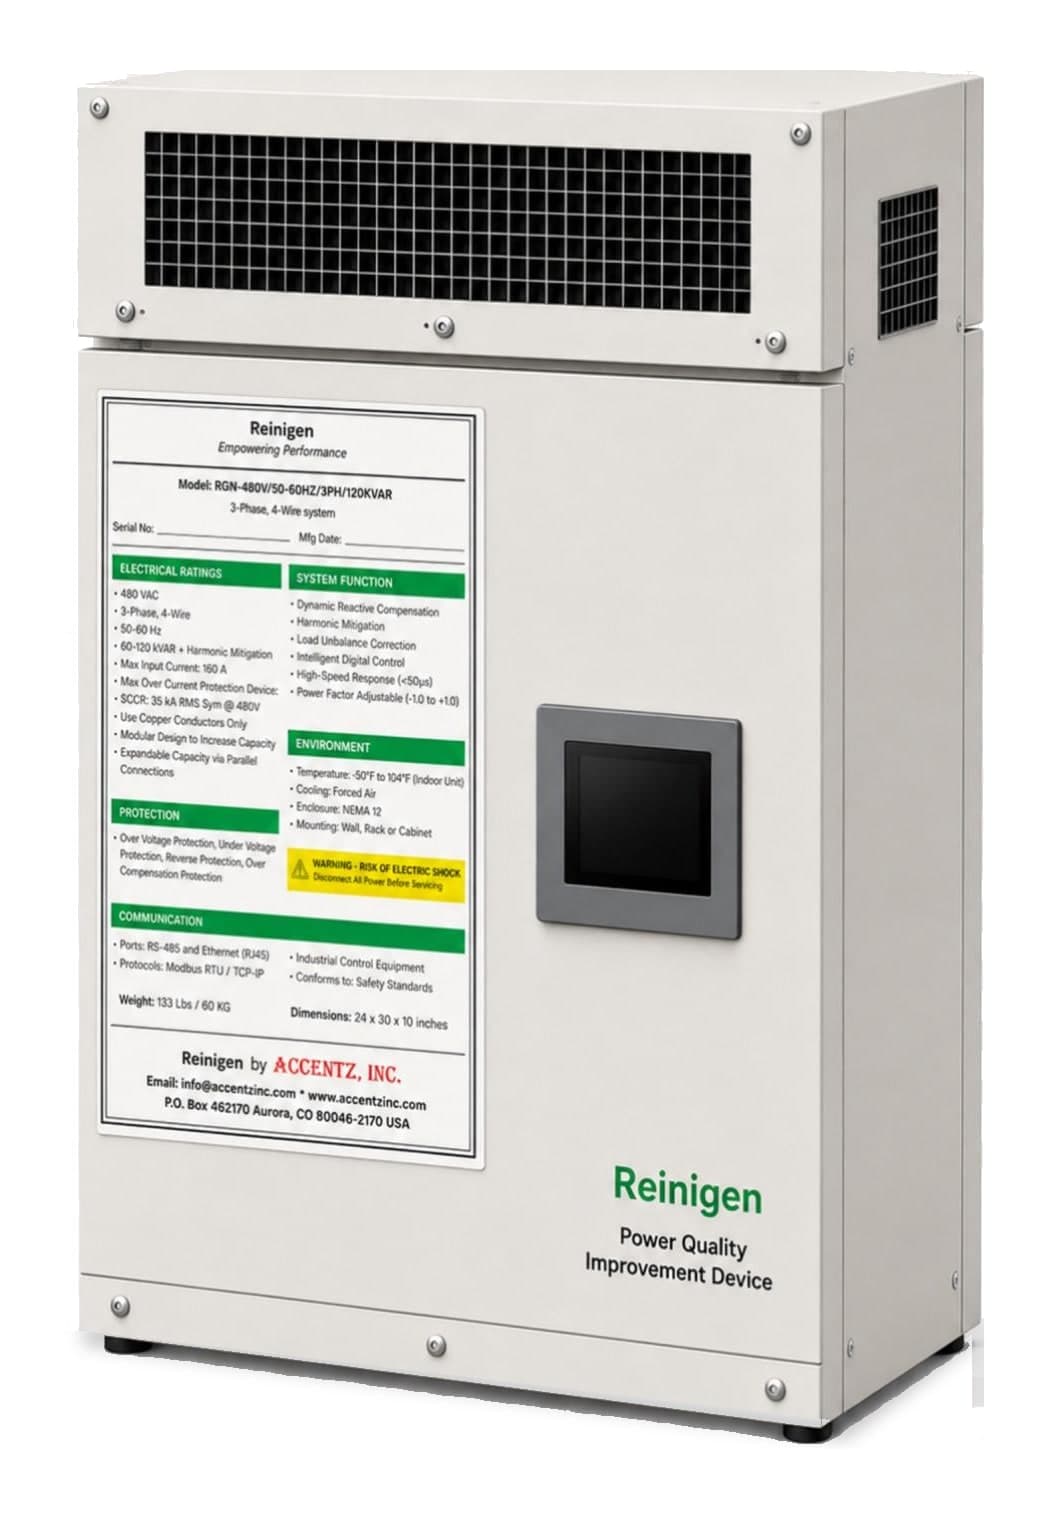
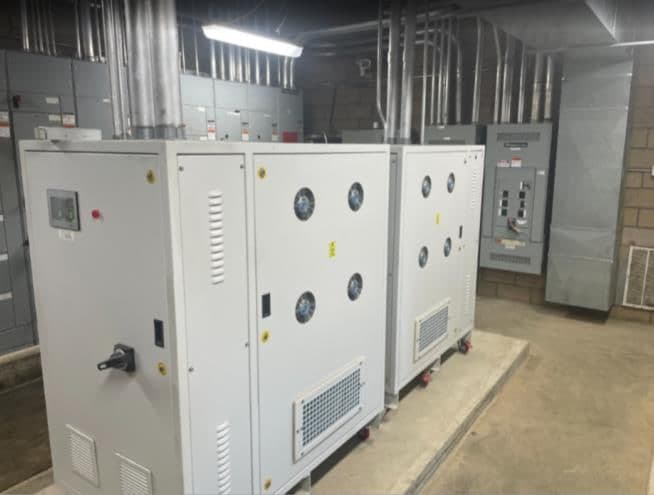
Reinigen for a panel. MPTS for the whole facility.
Two ways to correct power factor and harmonics, chosen from your measurements rather than a catalog.
Prove it on your own meter before you buy.
About $2,500 a month over the term.
- No obligation to buy at the end of the term
- Your own licensed electrician installs the unit
- We measure before and after; you keep the data
- At month six: buy, lease, keep renting, expand, or return it
Is your facility a fit? Five questions.
The same questions an engineer asks on a first call. It takes about a minute, and your answers go with your request.
Do your electric bills or demand charges keep rising?
Question 1 of 5